library(terra)
library(ggplot2)
library(tidyterra)7 Plotting spatial data
file <- here::here("data", "avhrr-only-v2.20160503.nc")sst_layer <- rast(file, subds = "sst") |>
rotate()
sst_layerclass : SpatRaster
dimensions : 720, 1440, 1 (nrow, ncol, nlyr)
resolution : 0.25, 0.25 (x, y)
extent : -180, 180, -90, 90 (xmin, xmax, ymin, ymax)
coord. ref. : lon/lat WGS 84 (CRS84) (OGC:CRS84)
source(s) : memory
varname : sst (Daily sea surface temperature)
name : sst_zlev=0
min value : -1.80
max value : 32.69
unit : degrees C
time (days) : 2016-05-03 plot(sst_layer)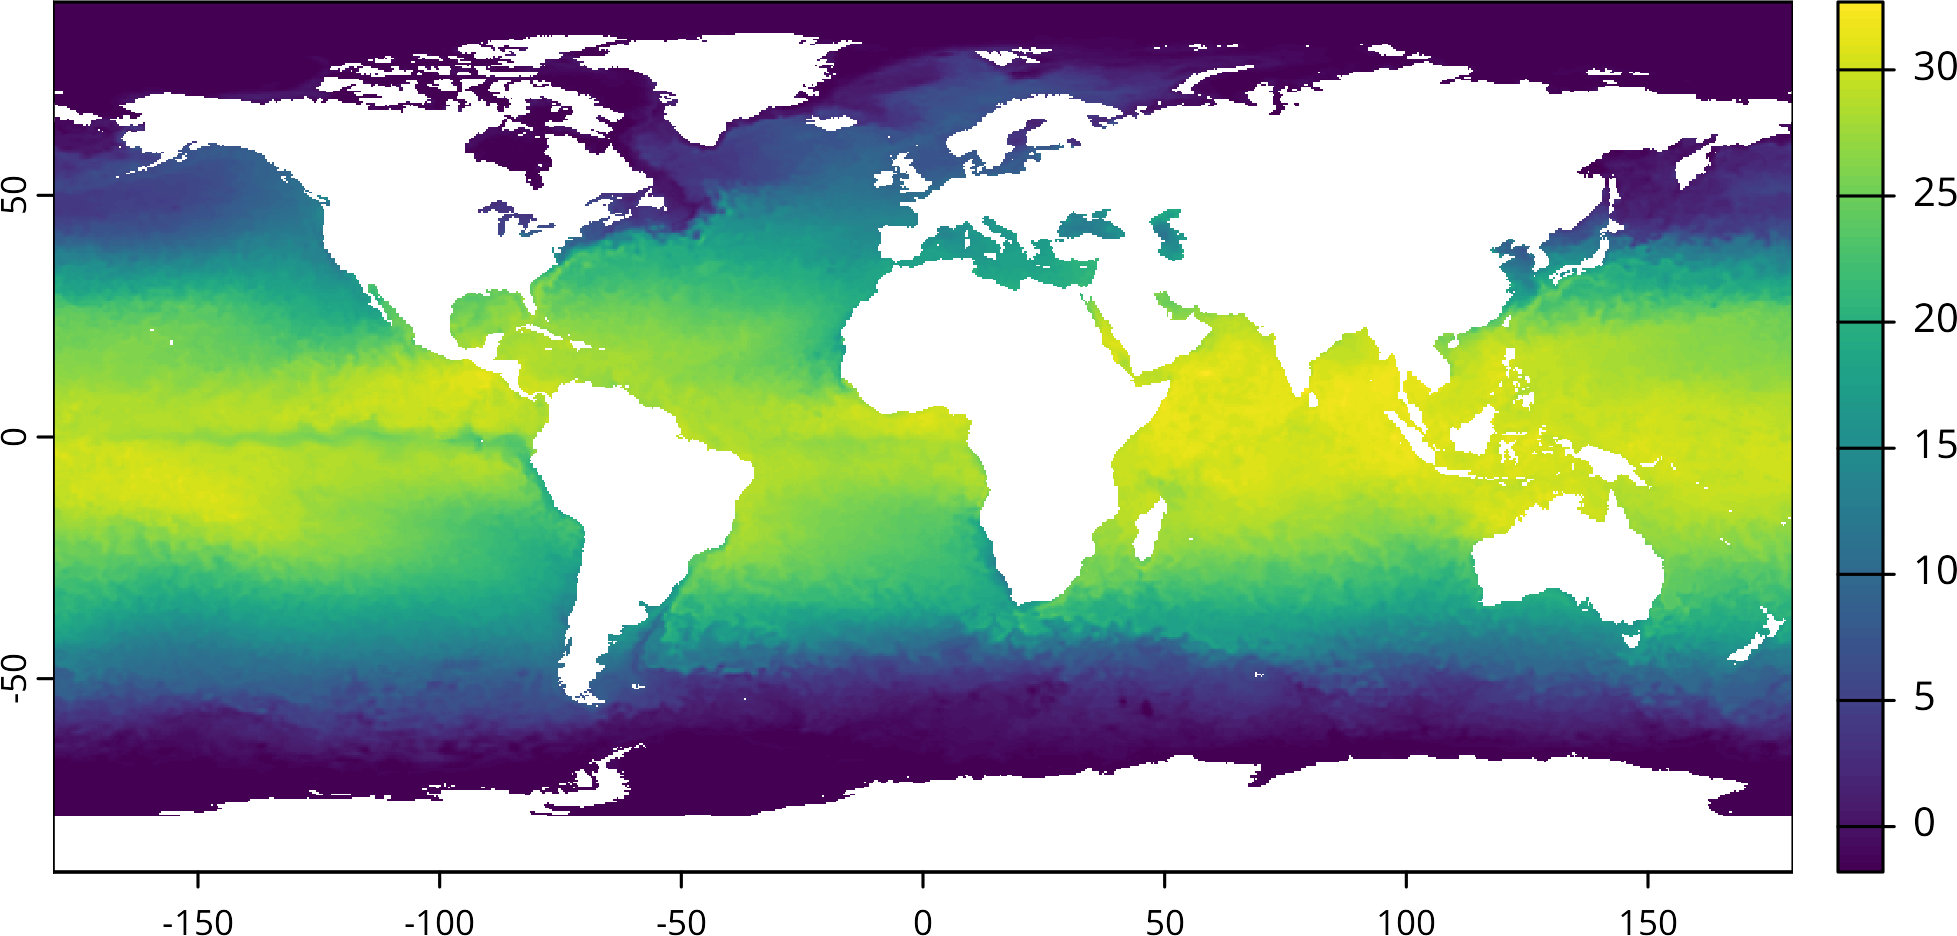
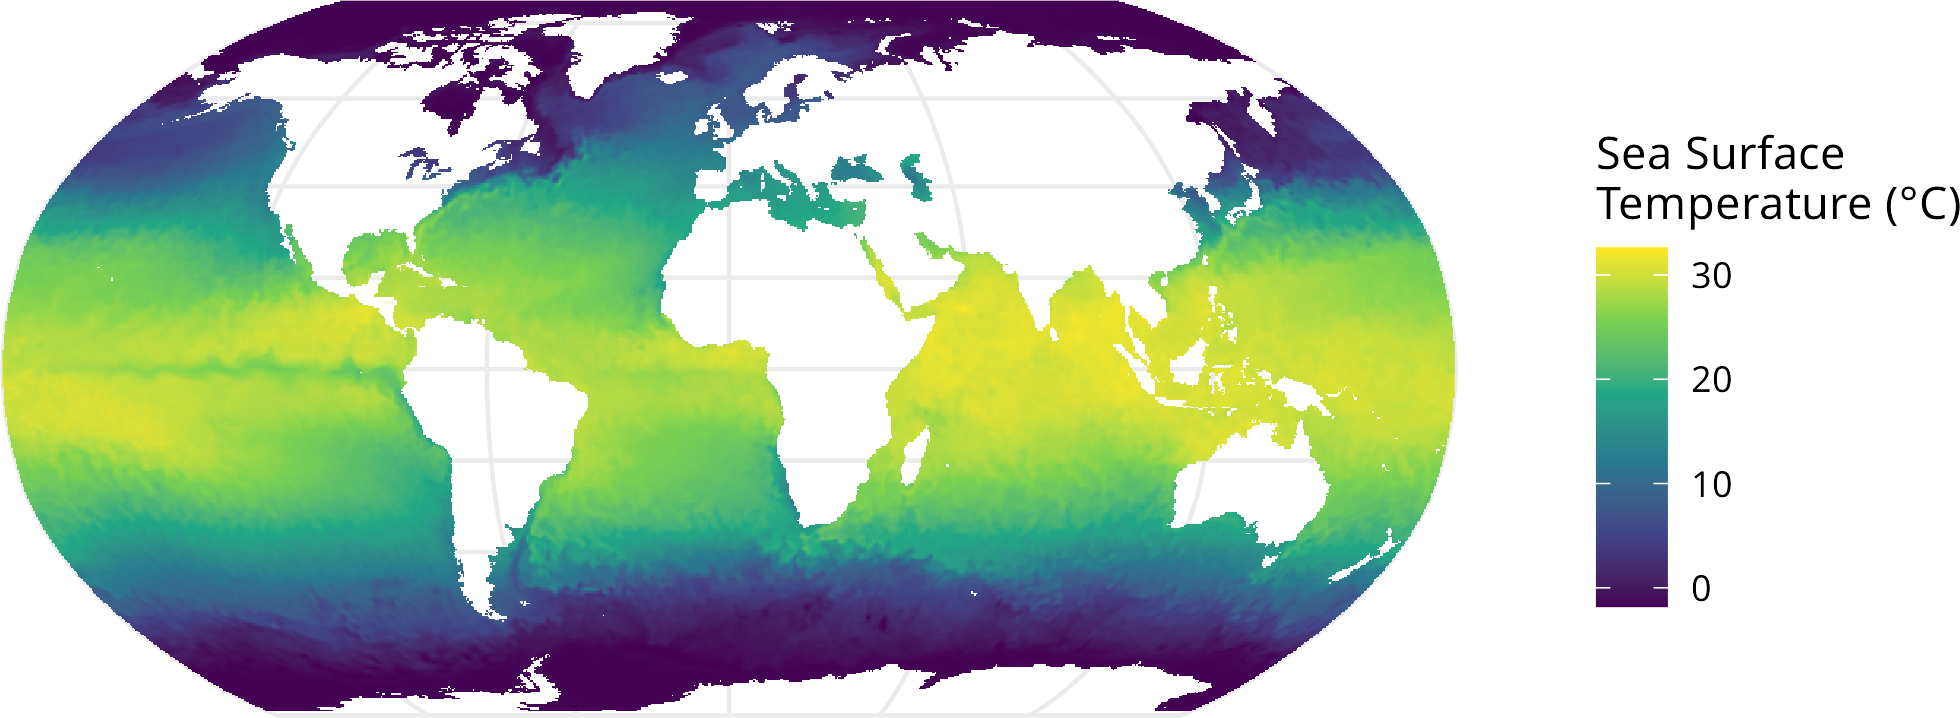
ggplot() +
  geom_spatraster(data = sst_layer) +
  scale_fill_viridis_c(na.value = "transparent") +
  labs(fill = "Sea Surface\nTemperature (°C)") +
  coord_sf(crs = "+proj=robin")