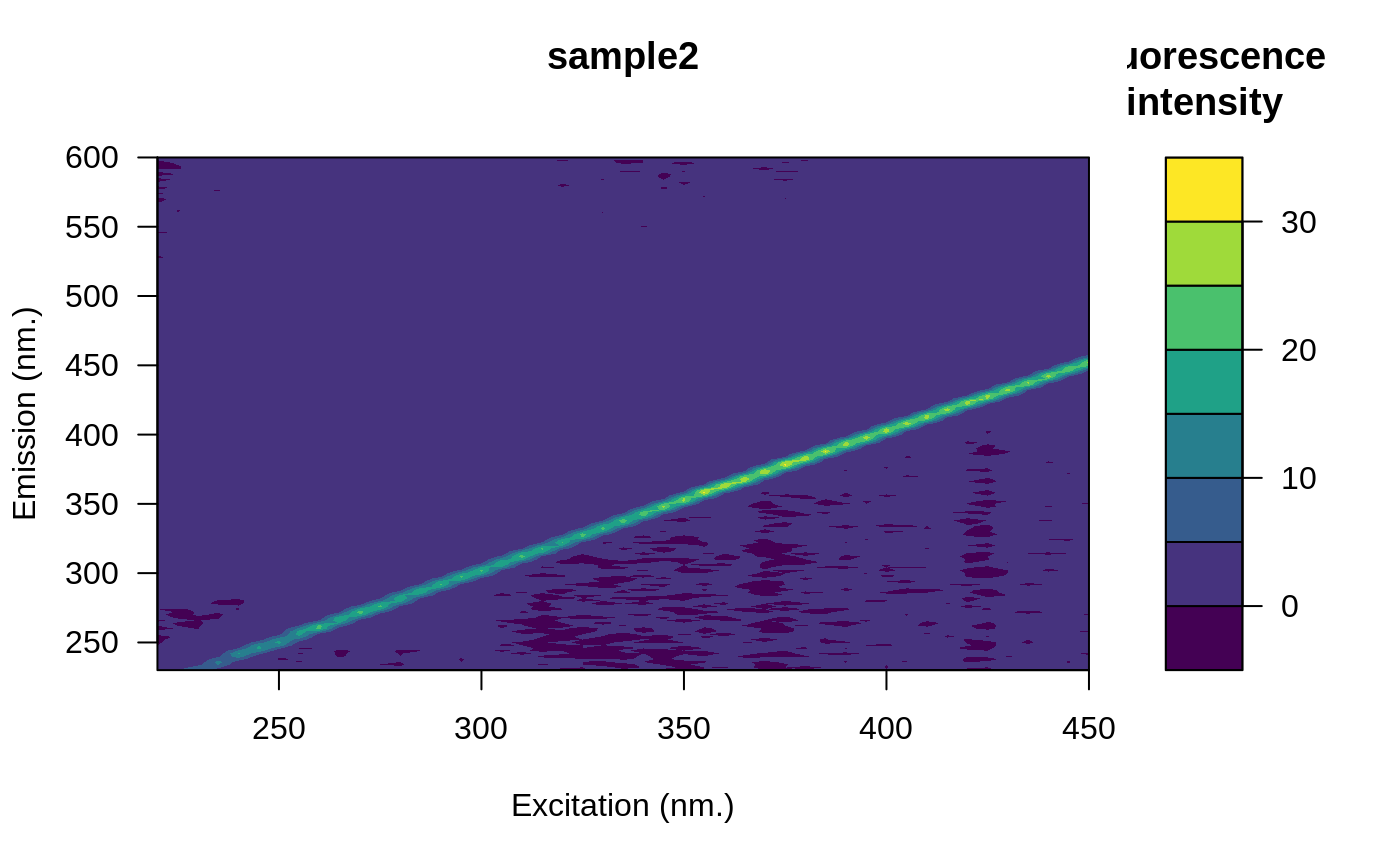
Skip to contents

Surface plot of eem

Usage

# S3 method for class 'eemlist'
plot(x, which = 1, interactive = FALSE, show_peaks = FALSE, ...)

Arguments

x

An object of class eemlist.

which

An integer representing the index of eem to be plotted.

interactive

If TRUE a Shiny app will start to visualize EEMS.

show_peaks

Boolean indicating if Cobble's peaks should be displayed on the surface plot. Default is FALSE.

...

Extra arguments for image.plot.

Examples

folder <- system.file("extdata/cary/scans_day_1/", package = "eemR")
eem <- eem_read(folder, import_function = "cary")

plot(eem, which = 3)